The whole book at once
Combine positions across accounts and brokers, or look at one account on its own.
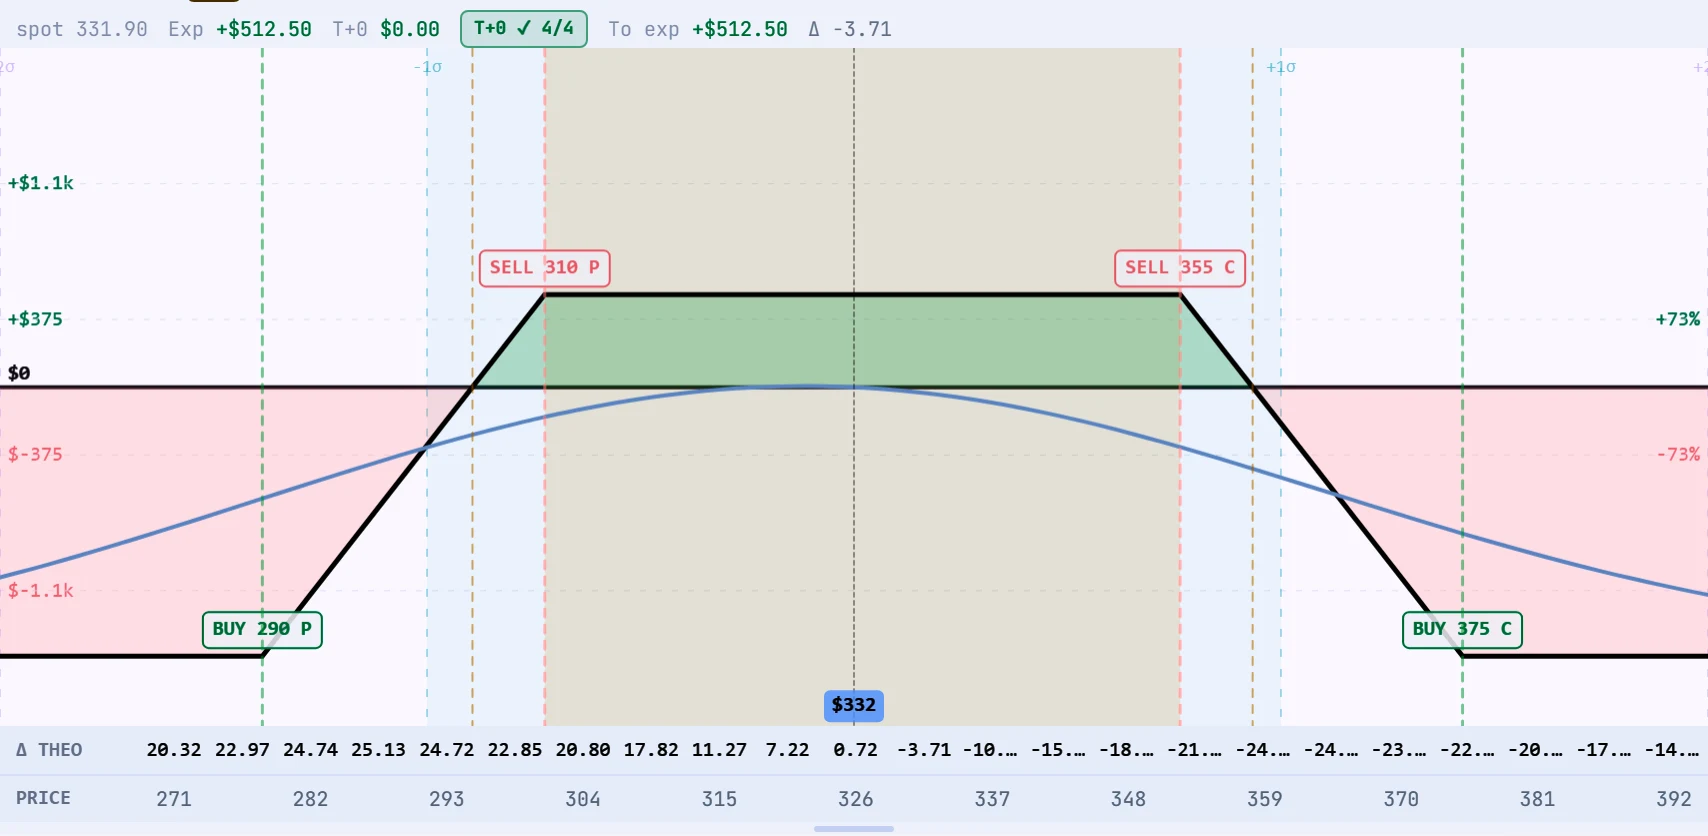
Positions from your accounts at Interactive Brokers and tastytrade sit on one graph. Drag the days to expiry, change implied volatility, or switch on the crash band to see the bad day.
Combine positions across accounts and brokers, or look at one account on its own.
A days-to-expiry slider redraws the curve for any date to expiry, and an implied volatility control moves the whole curve up or down.
A T+0 check confirms the graph matches the market prices of every leg before you rely on it.
The solid line is the result at expiry. The blue line is today. Lines in between show the trade at each date, so you can see how time decay changes it.
Days to expiry, implied volatility and the crash band sit under the graph. Each one changes the picture without changing your position.

Live terminal screens; prices are for illustration.
Yes. The same risk graph, with the same controls, is used everywhere in Trident.
With an options pricing model using the implied volatility of each leg. Model values are estimates and are labelled as such.
Yes. Choose all accounts, a group, or a single account.