Every symbol, the same rules
Each screen checks every symbol on your list against the same delta, width, days and credit rules, so the results compare like with like.
Run screens for income, spreads, volatility and shaped structures, or write your own rules. Sort any column and open a result straight on the risk graph.
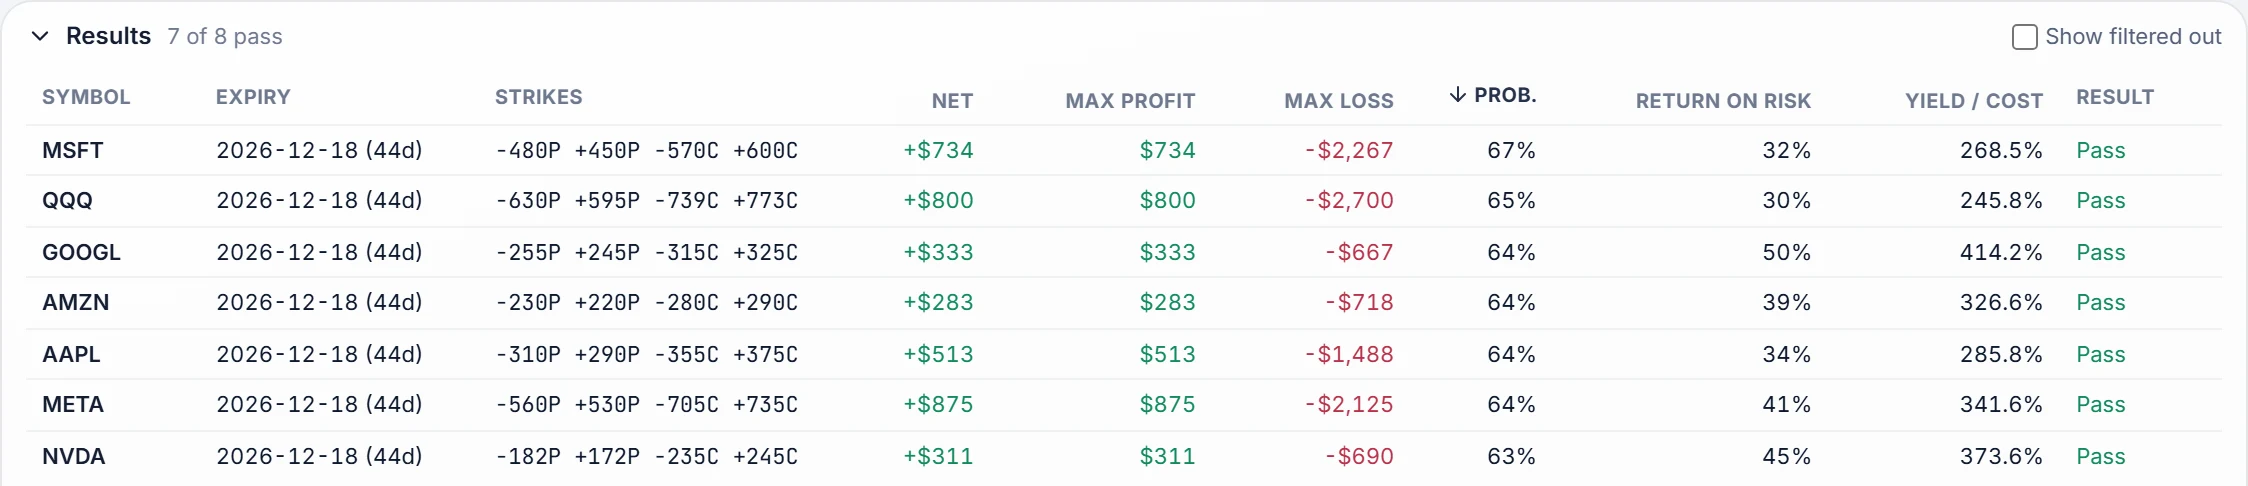
Each screen checks every symbol on your list against the same delta, width, days and credit rules, so the results compare like with like.
Sort by credit, width, delta, days to expiry or return on risk, ascending or descending, with one click on the column header.
Pick a result and it opens on the risk graph with its legs priced, ready to test with the crash band and to send to order management.
Screens cover covered calls, cash-secured puts, credit spreads, iron condors, butterflies, calendars and volatility setups. Each one shows the structure, not just a single option.
Each result shows why it passed: the strikes, the credit, the width and the probability the model gives it. Filtered-out symbols can be shown too, so nothing is hidden.
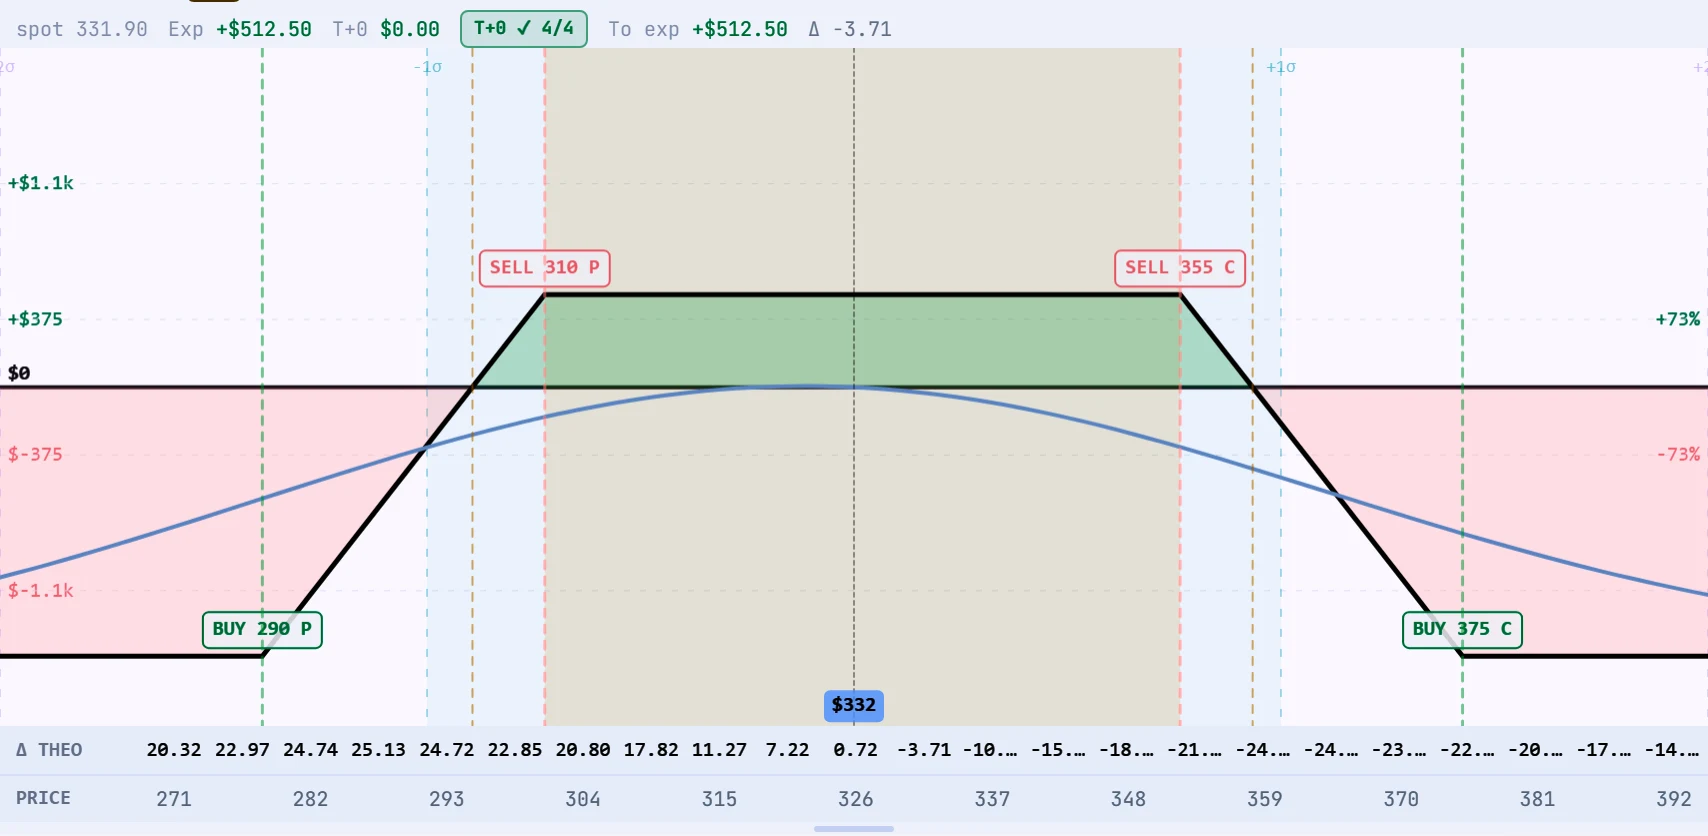
Live terminal screens; prices are for illustration.
Yes. Set your own rules for delta, days to expiry, width, credit and liquidity alongside the 27 built-in screens.
No. It finds candidates. A result opens on the risk graph, and orders only go to your broker after you stage and send them in order management.
Any optionable symbol your connected broker provides data for, in lists you choose.